Cluster Visualizer 3D
基于PCA和K-Means的高维数据聚类3D探索
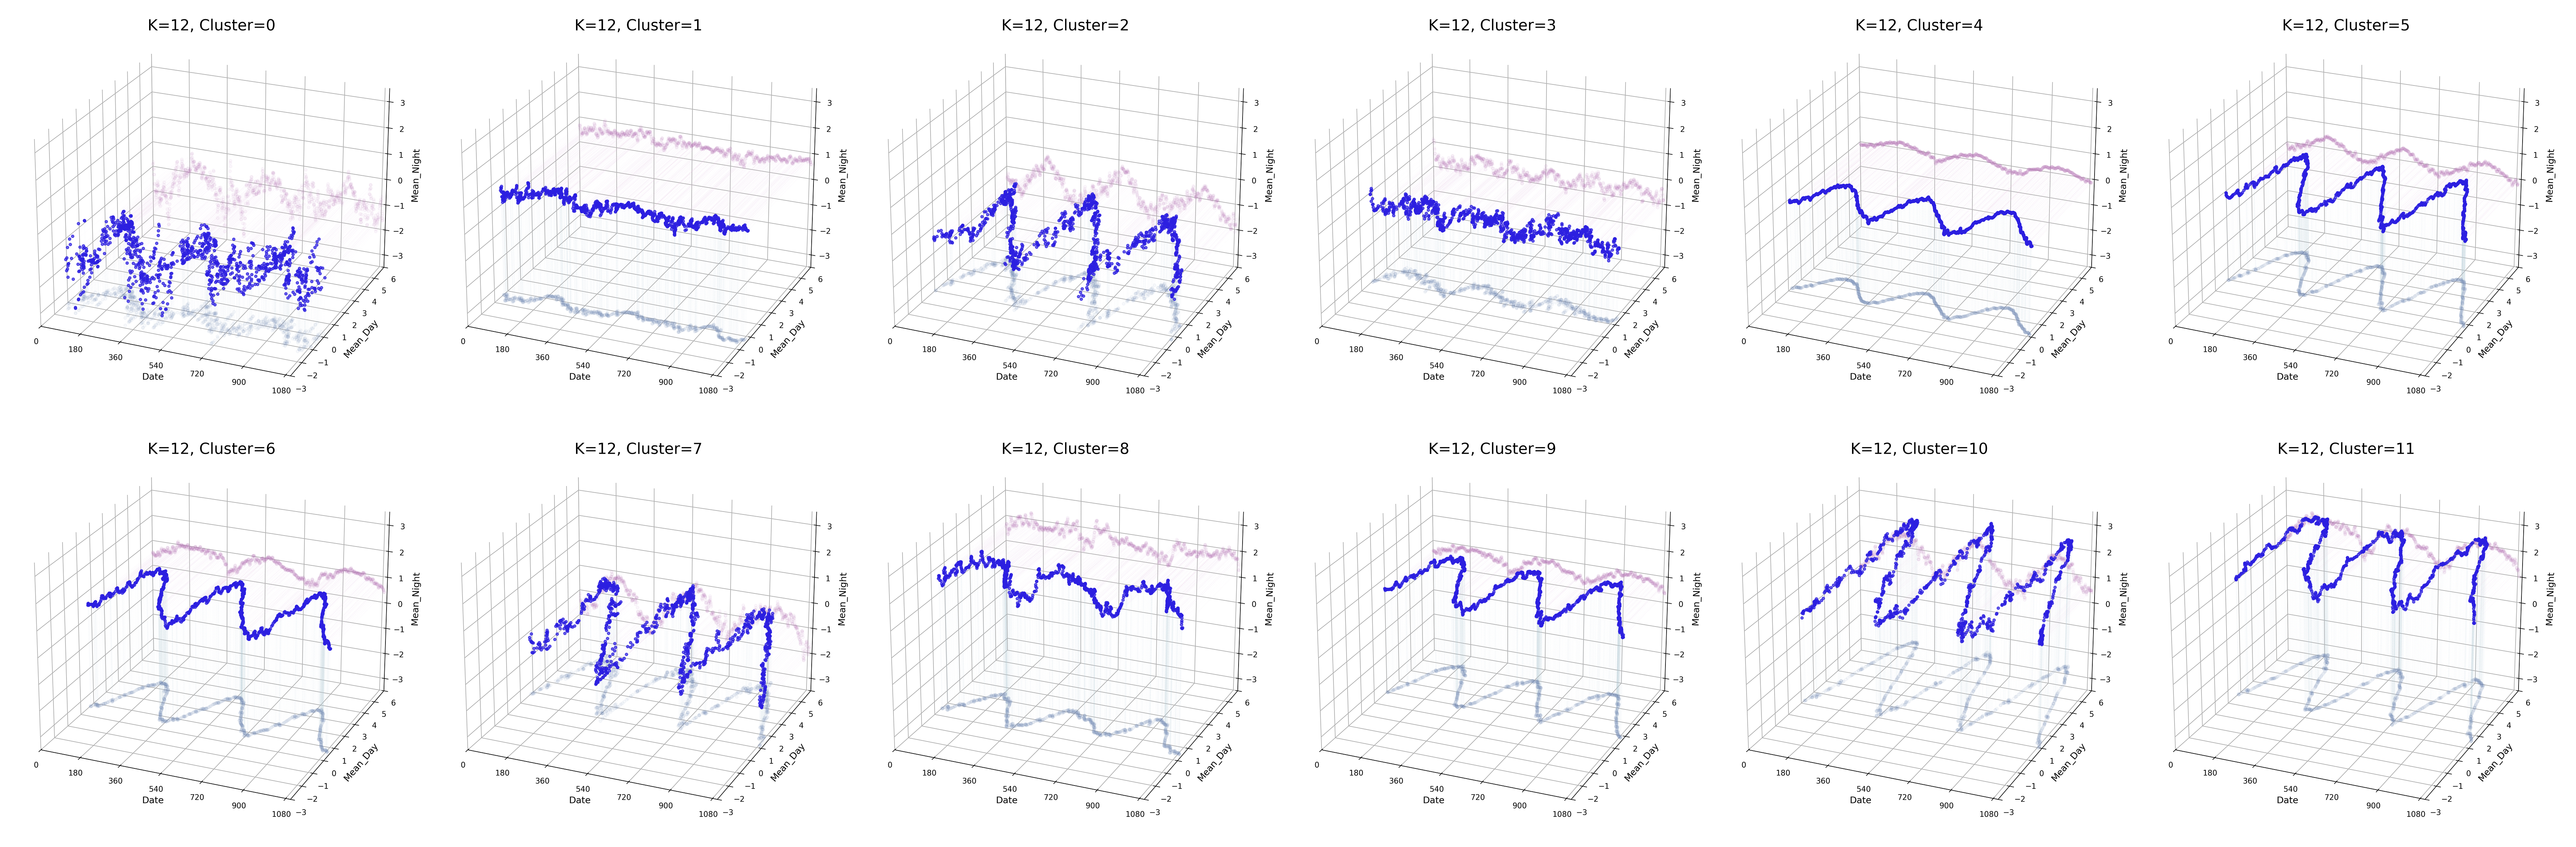
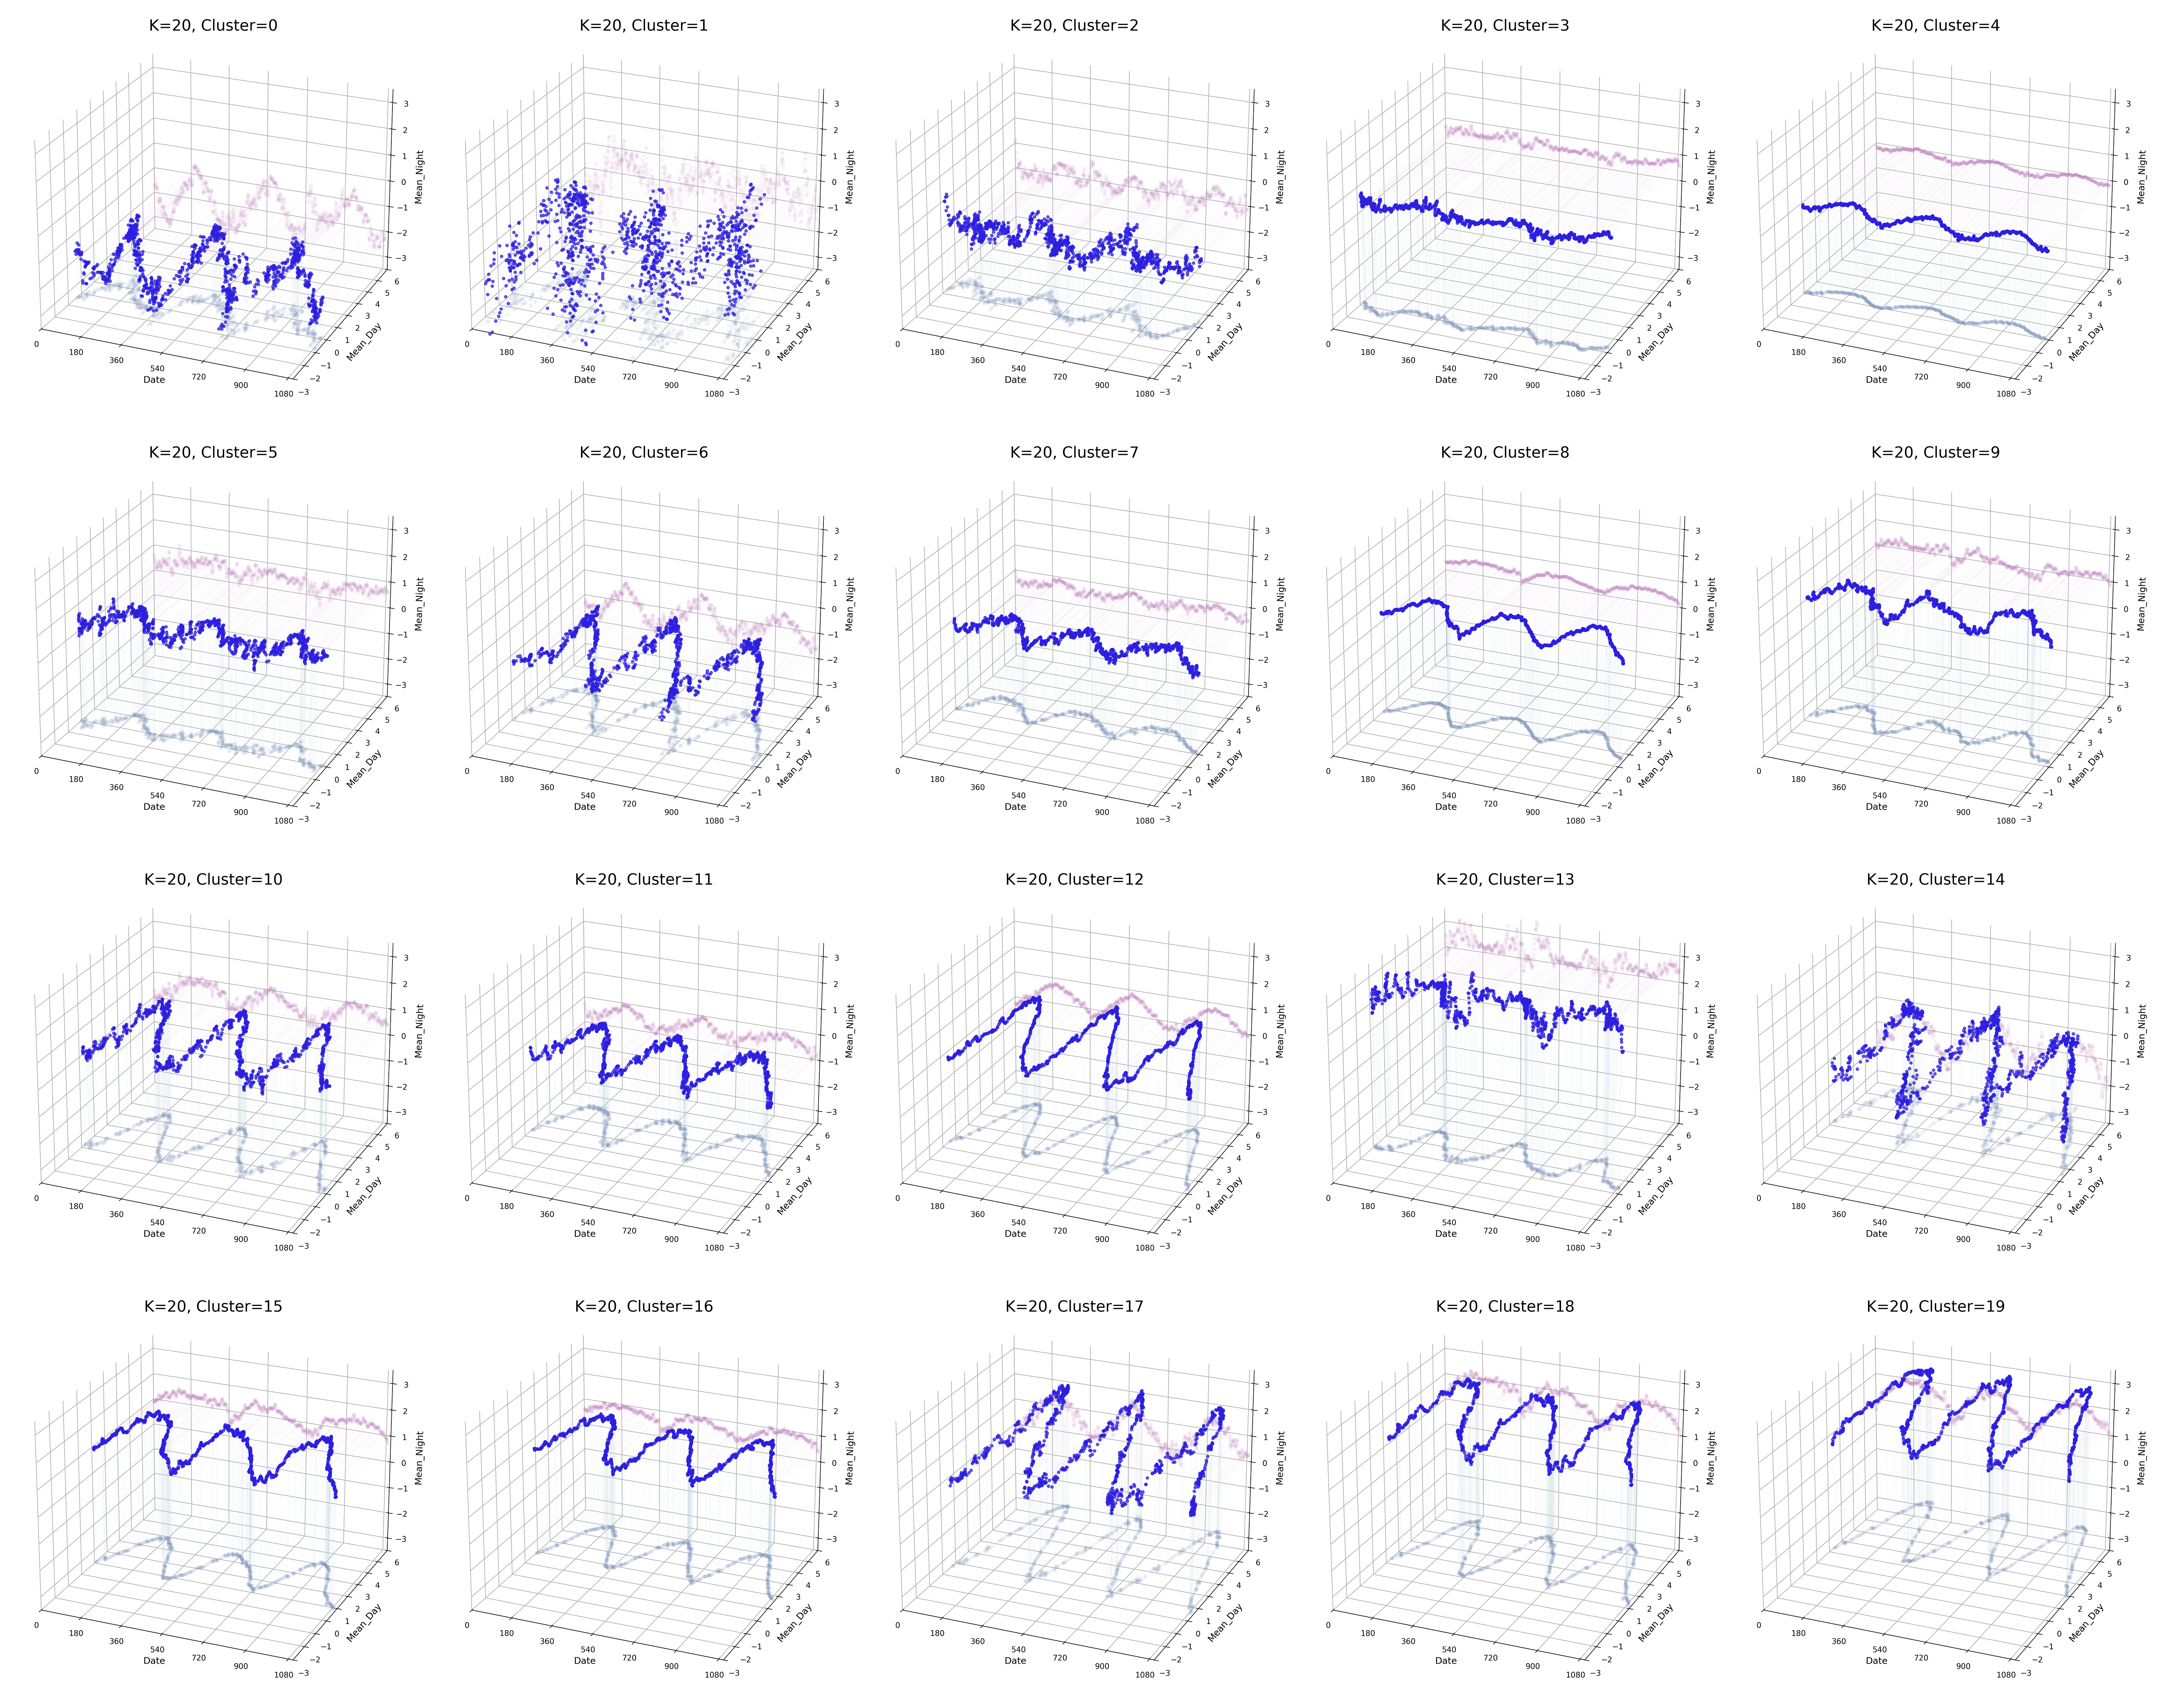
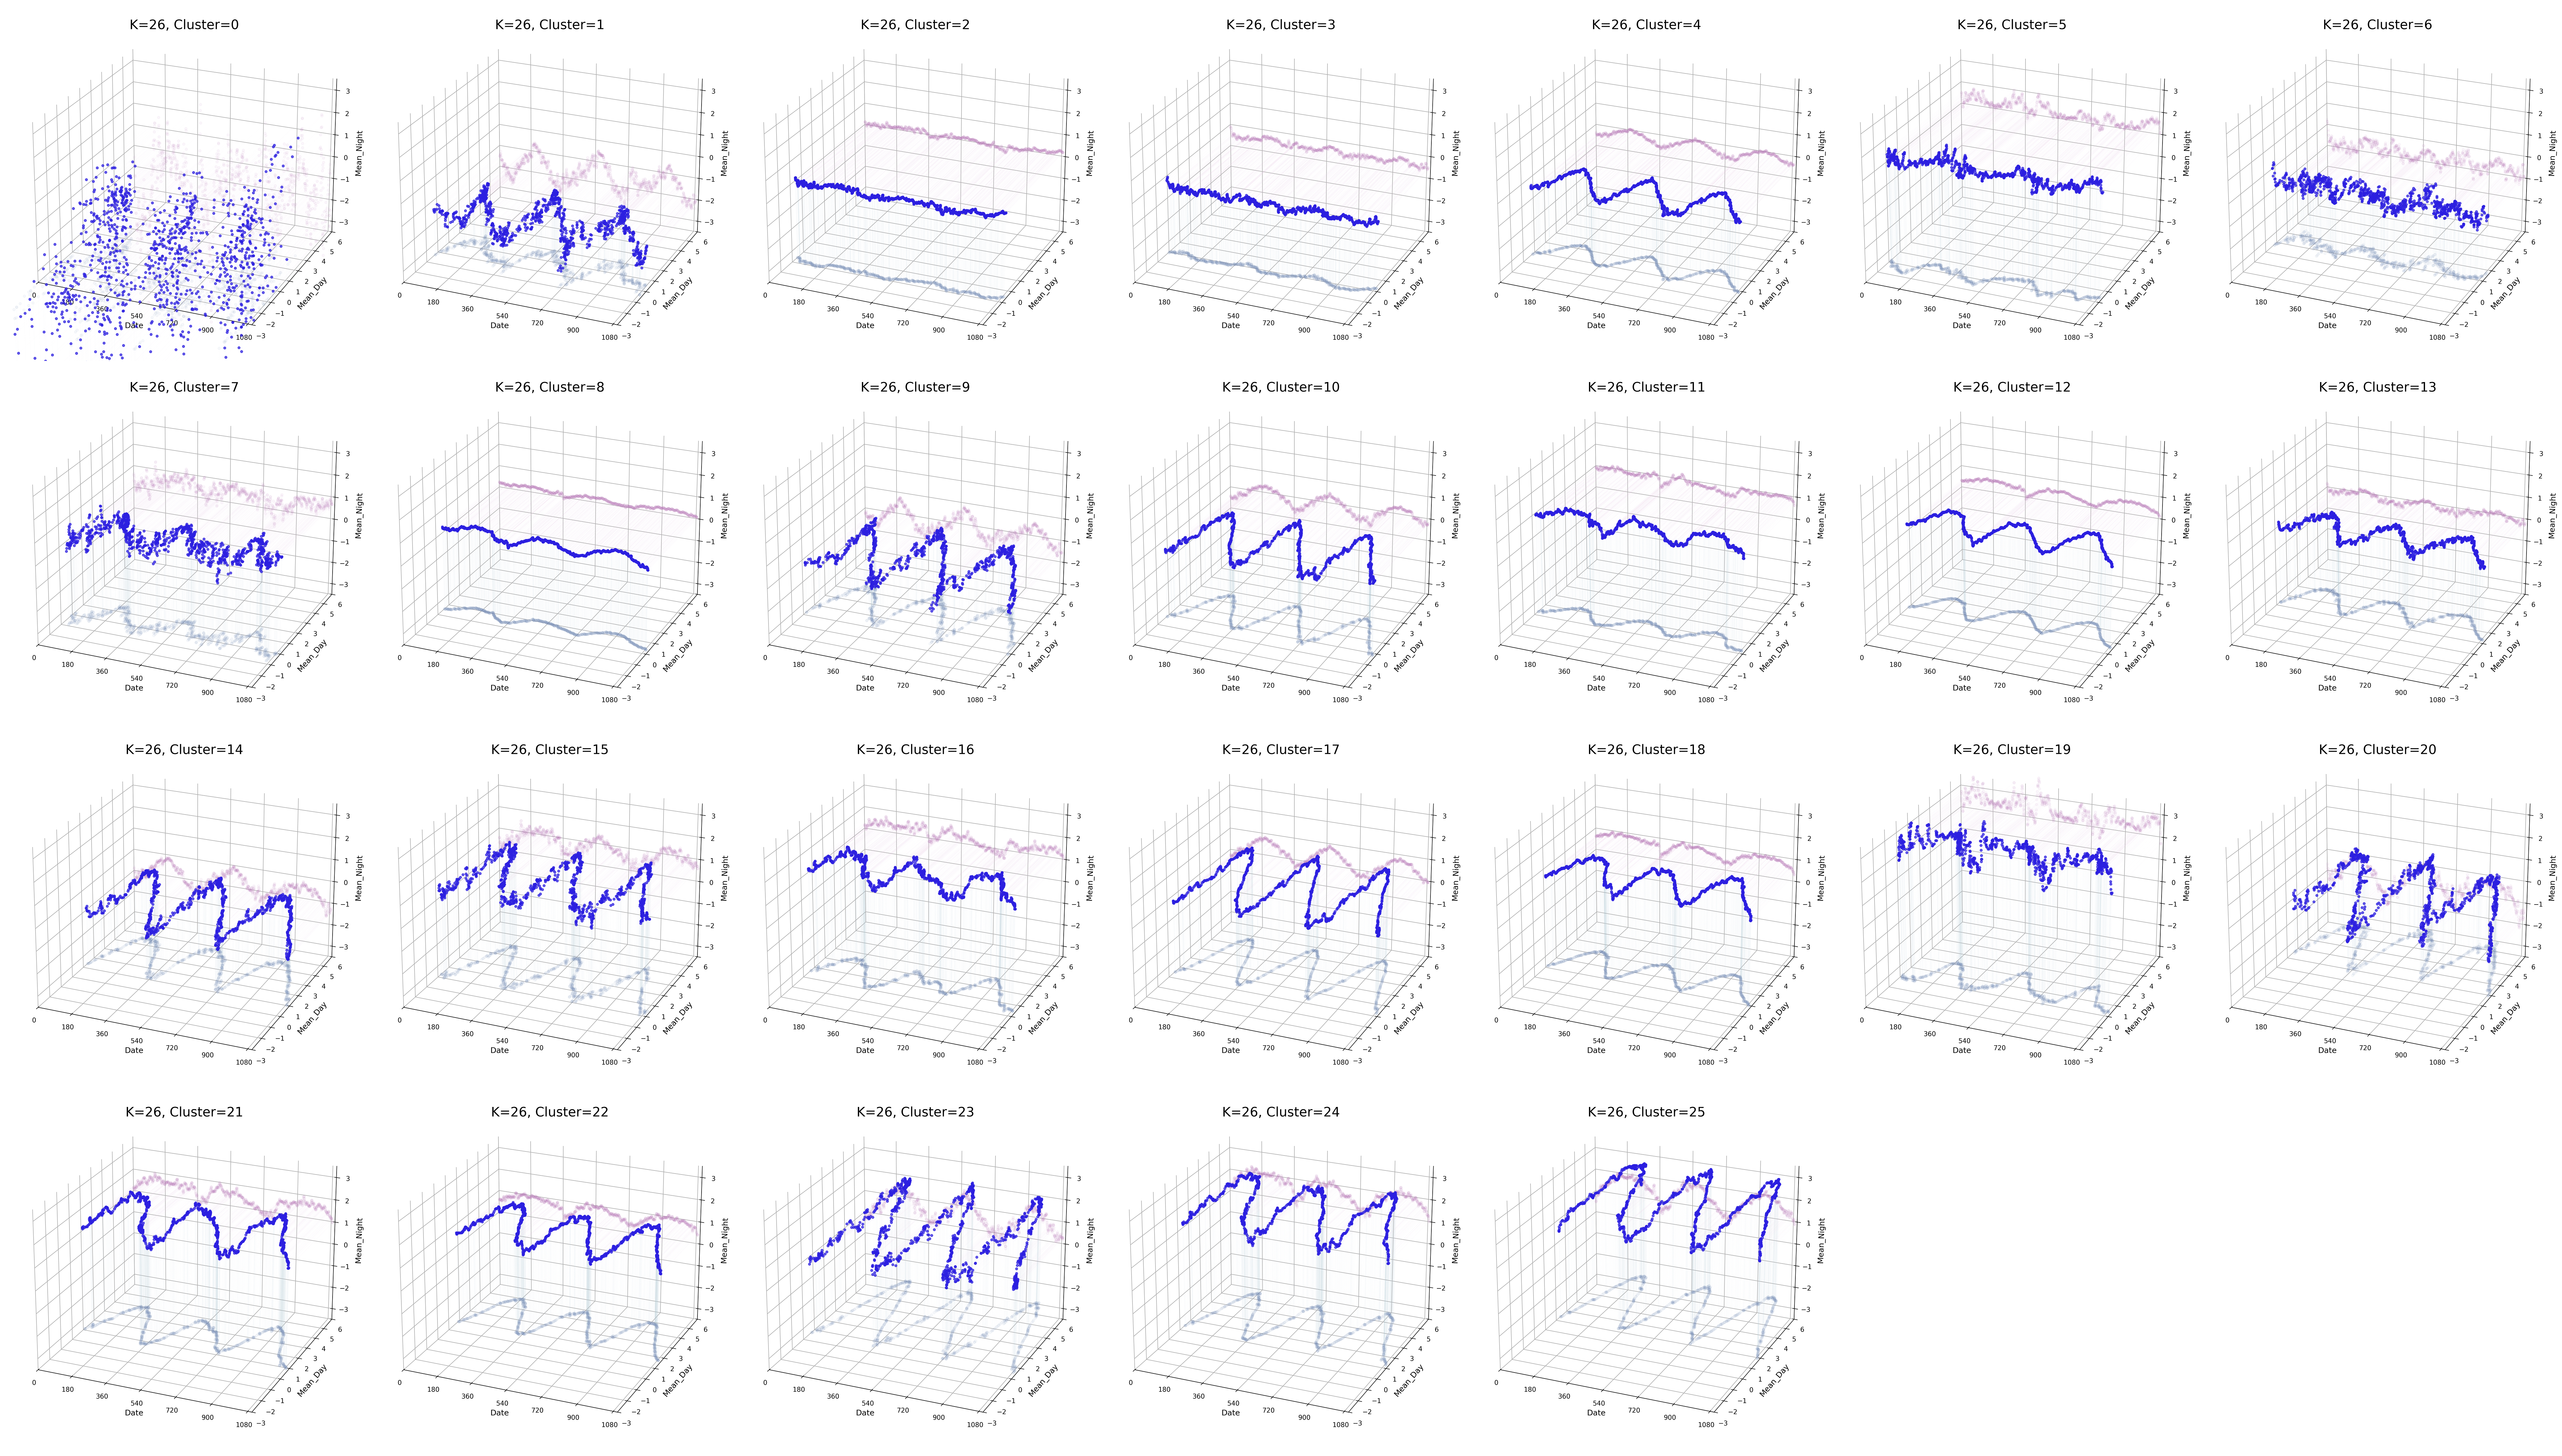
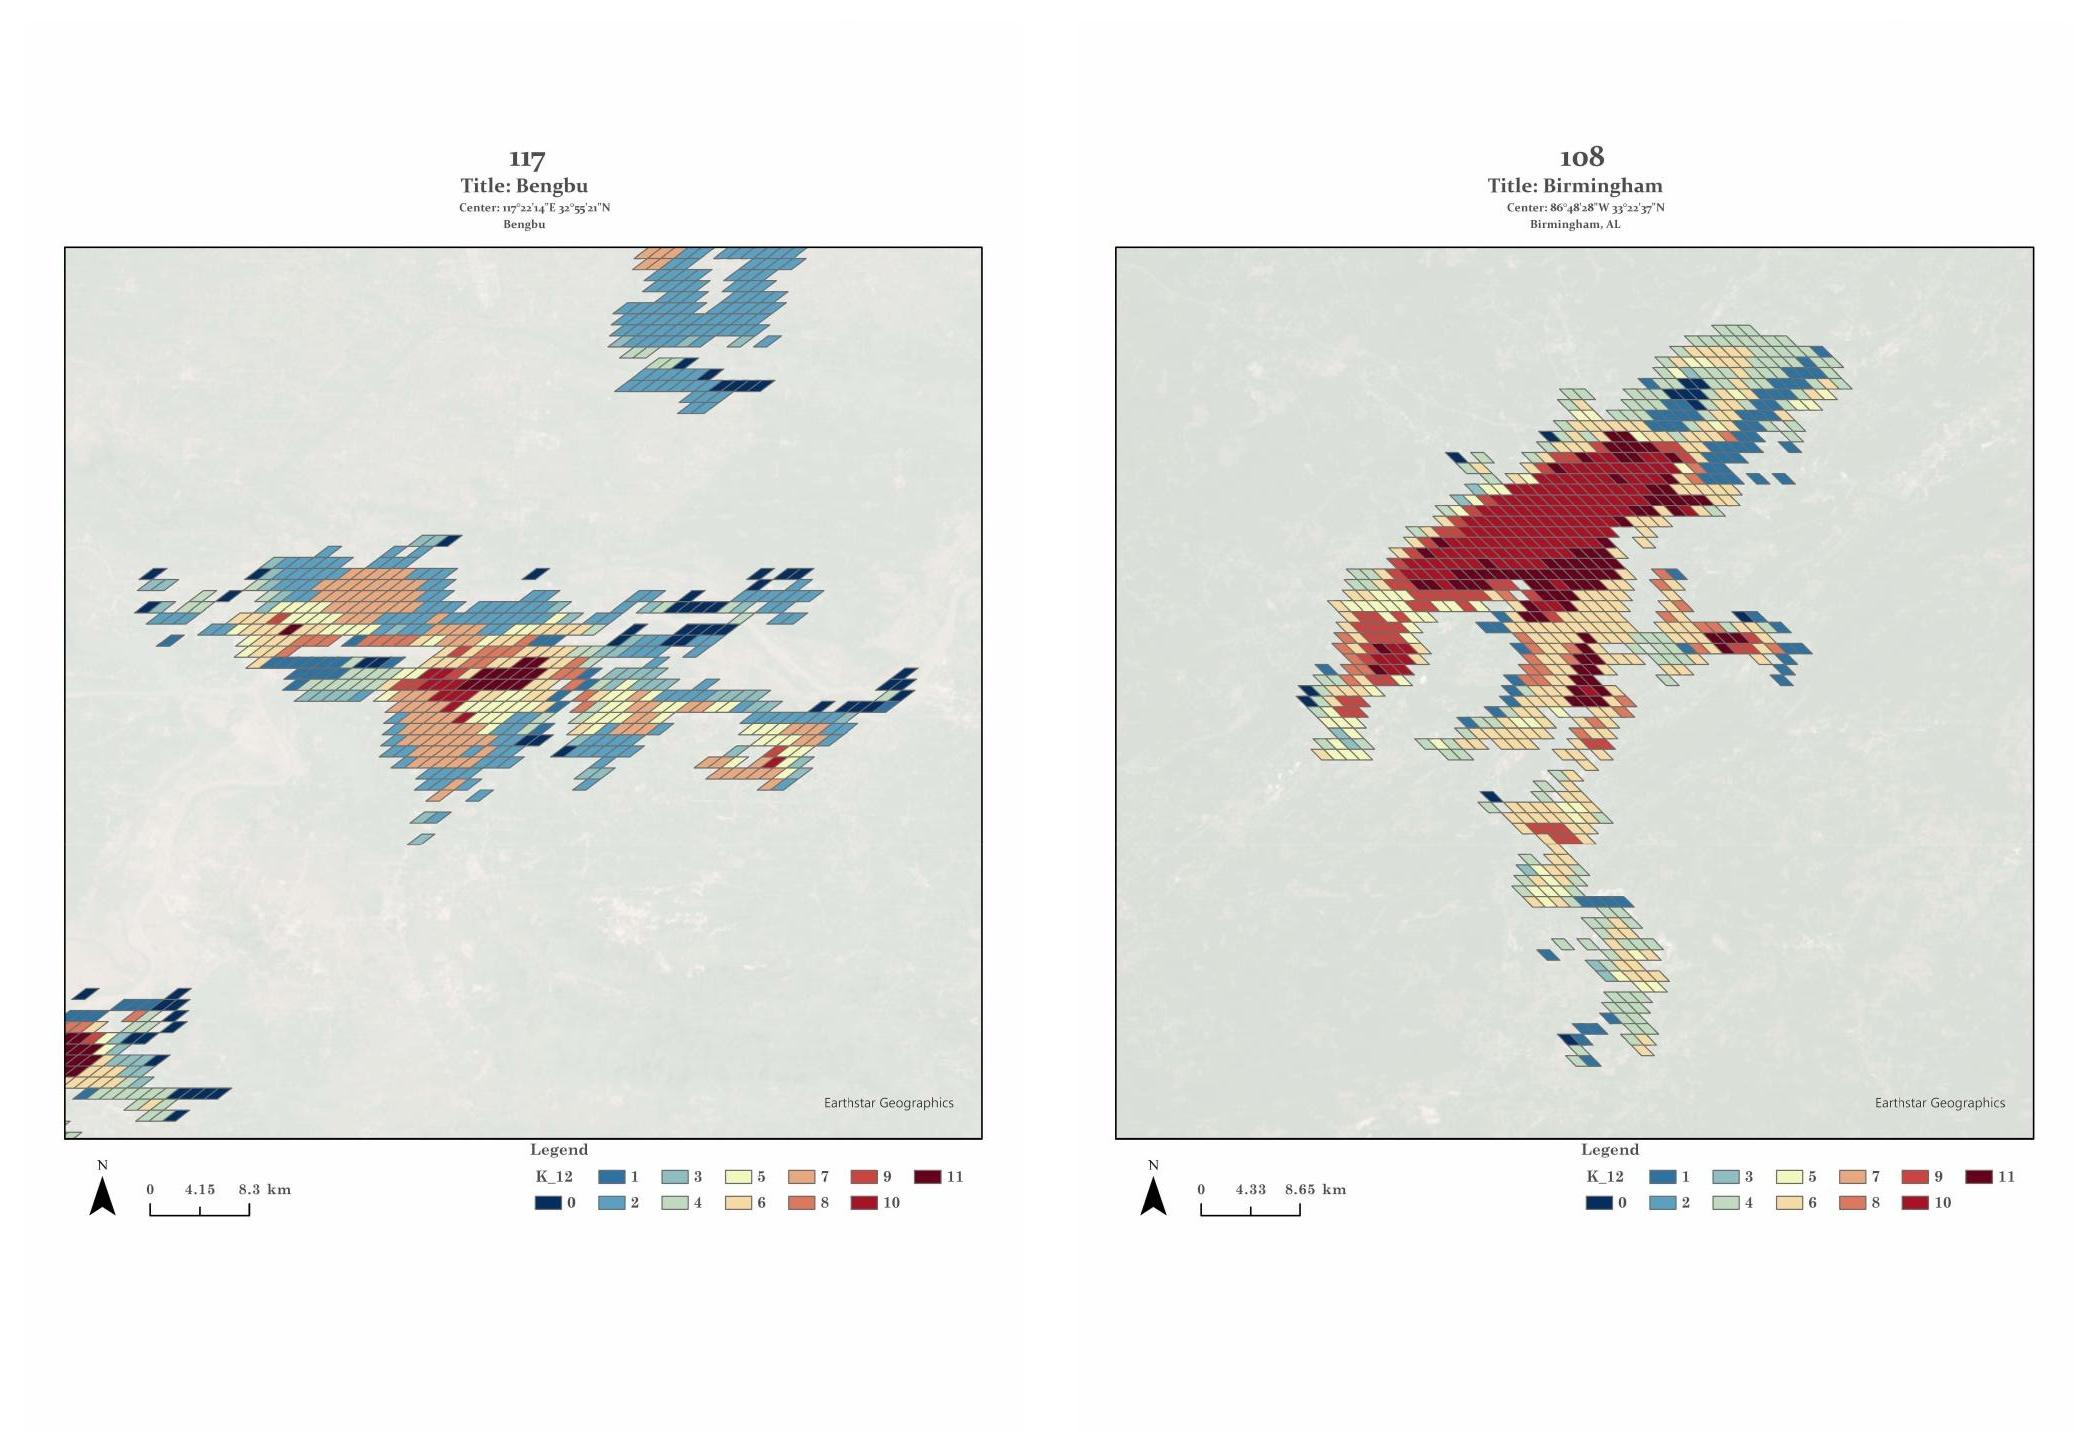
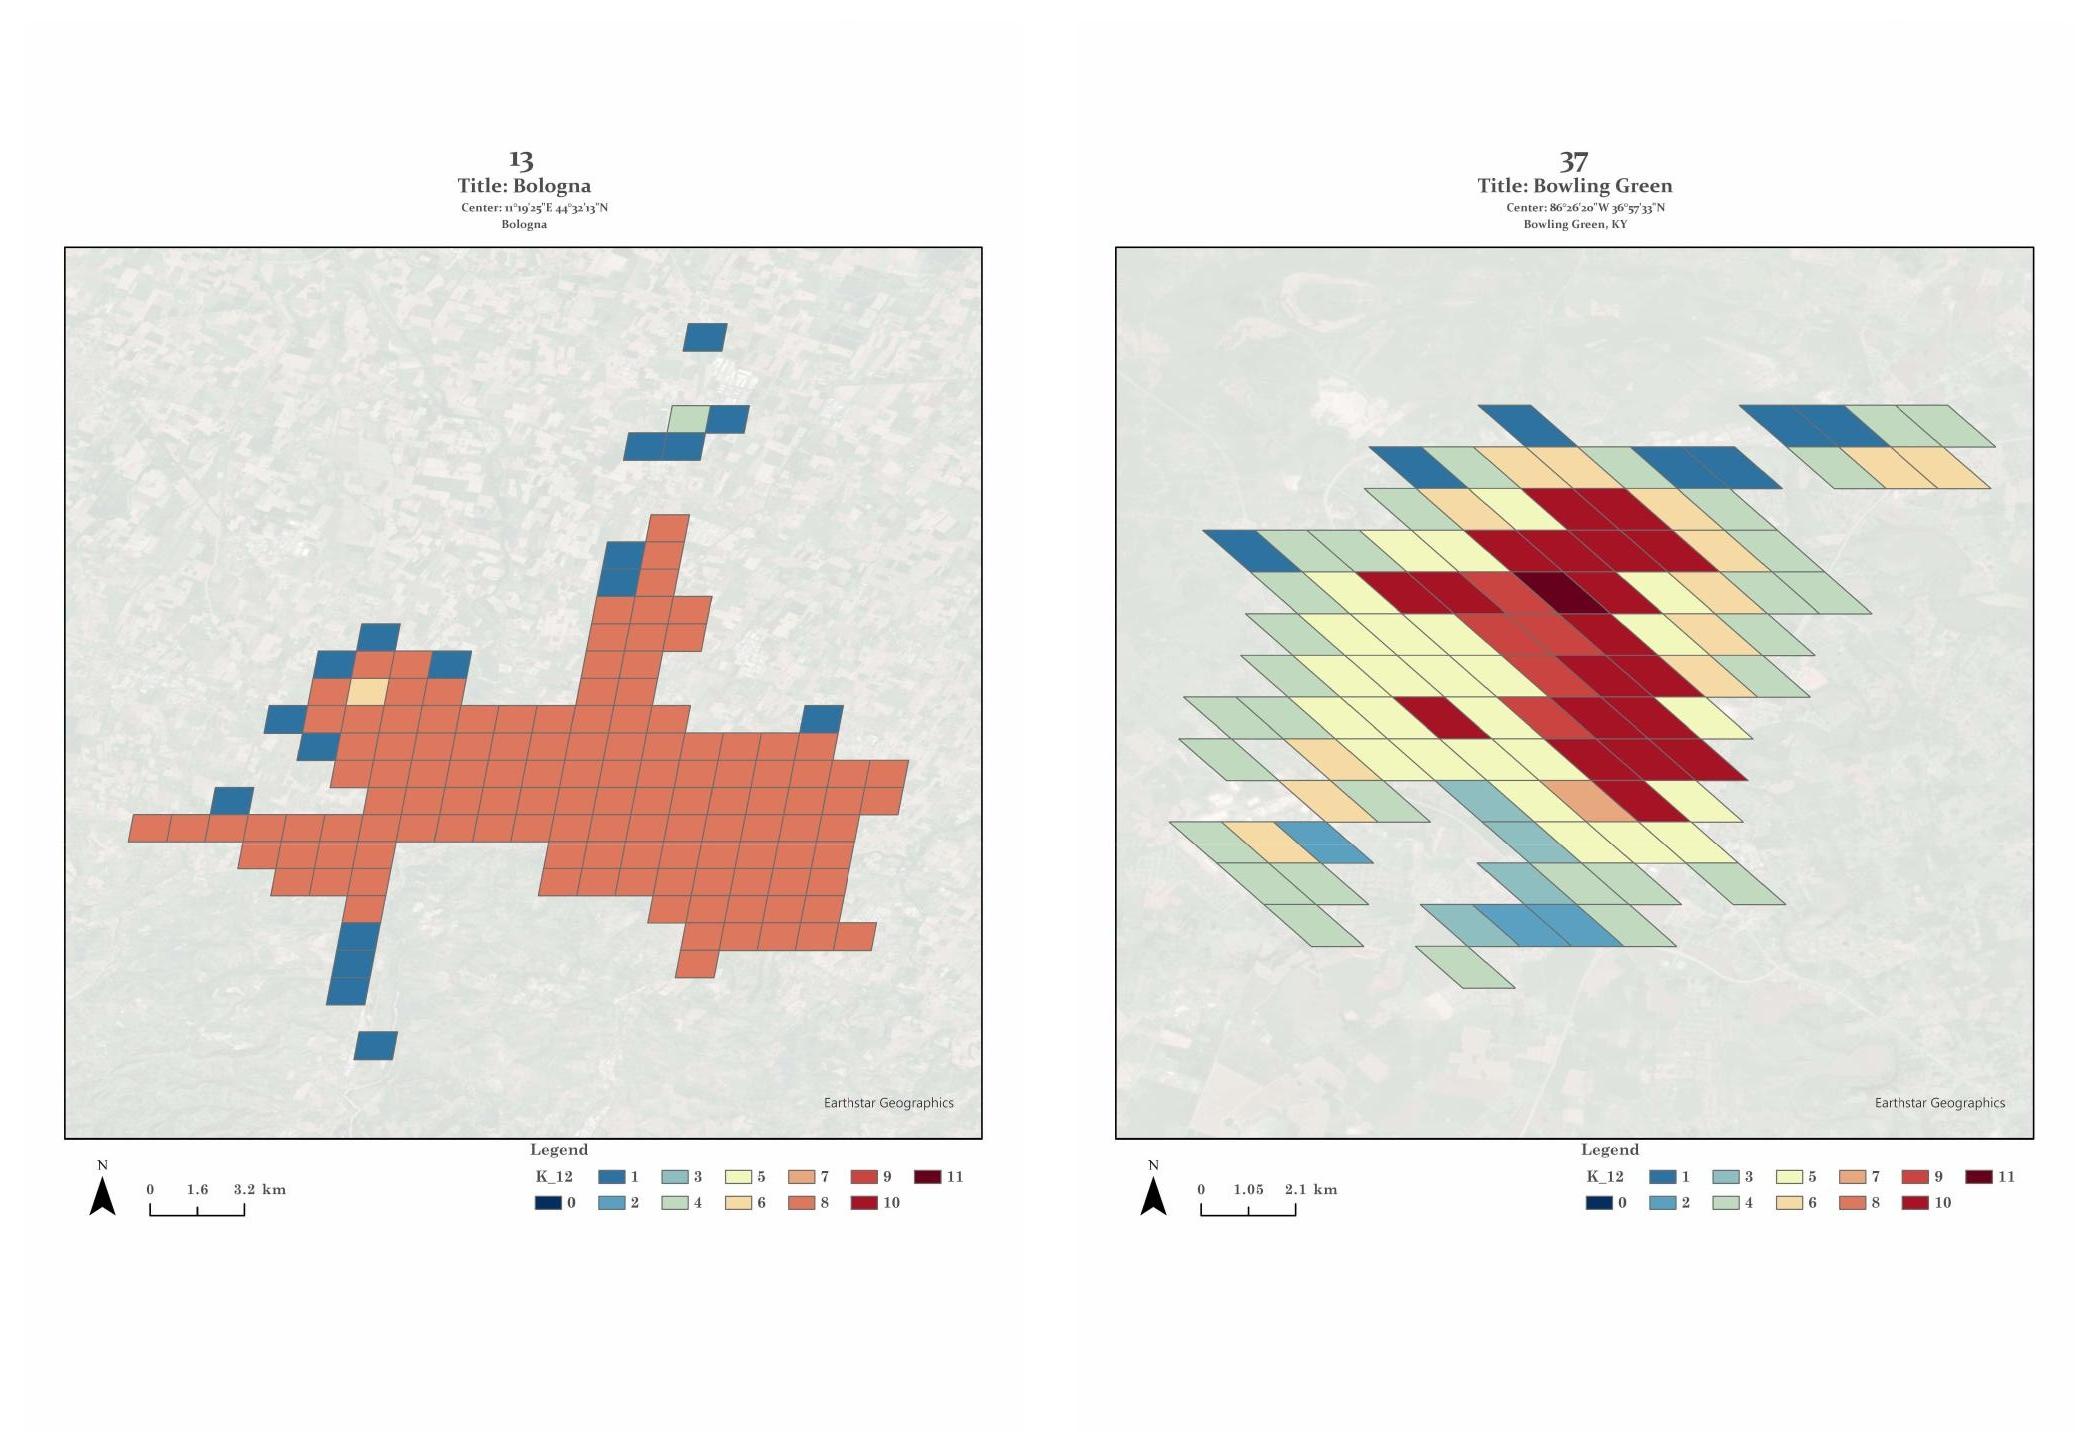
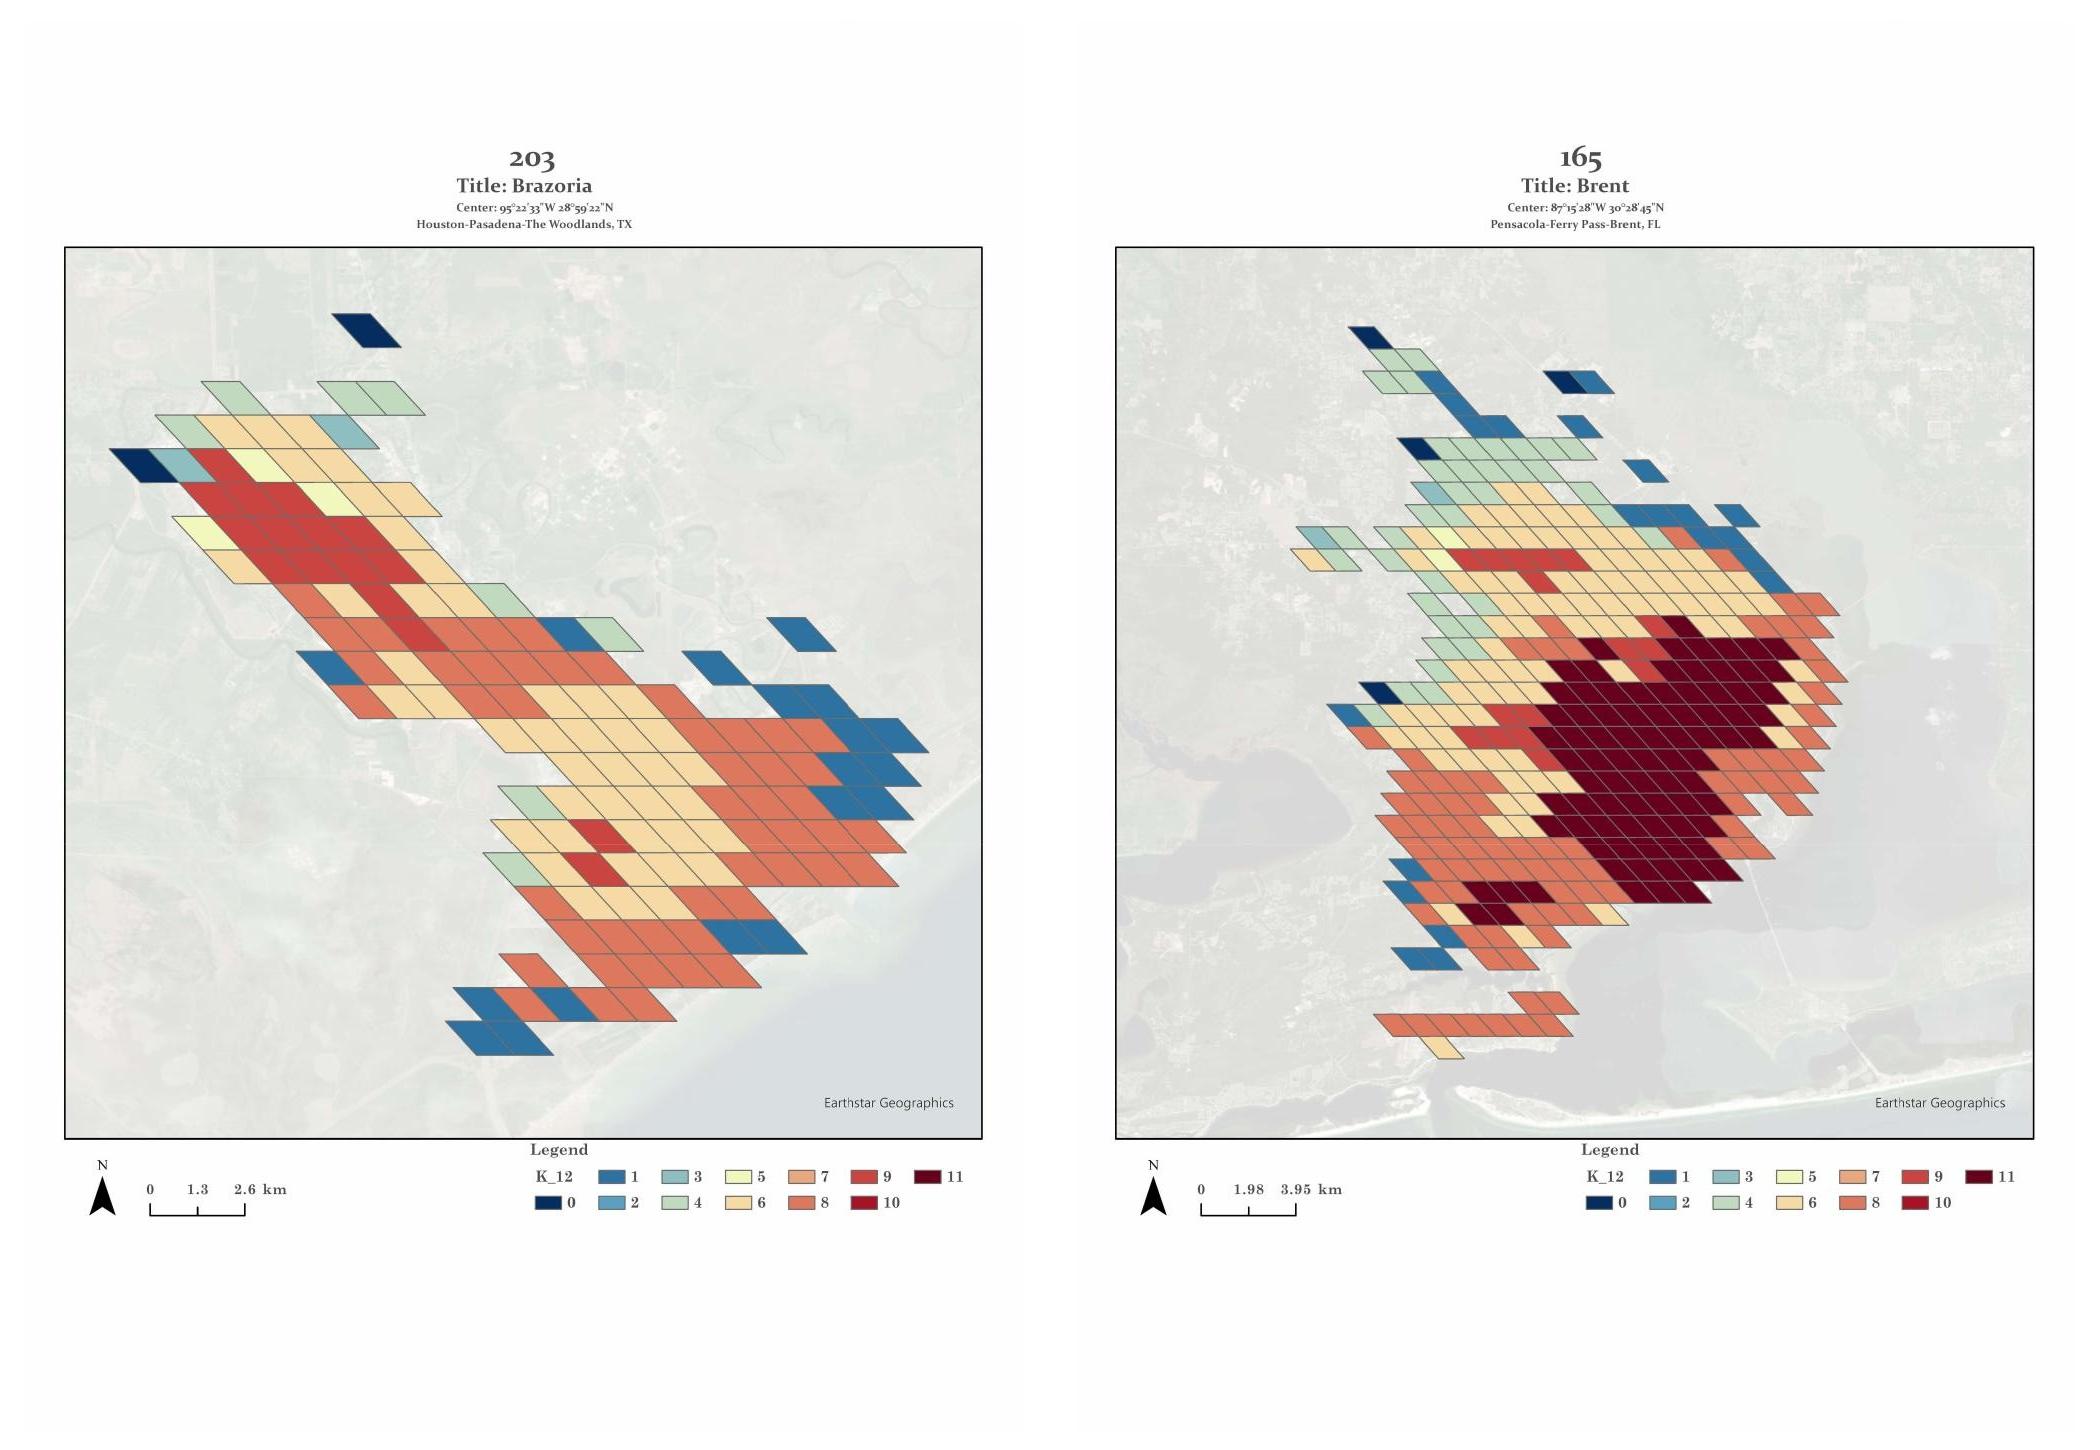
An interactive 3D visualization tool that enables users to explore clustered high-dimensional datasets. By applying PCA for dimensionality reduction and K-Means for clustering, project visualizes complex data patterns in an intuitive manner.
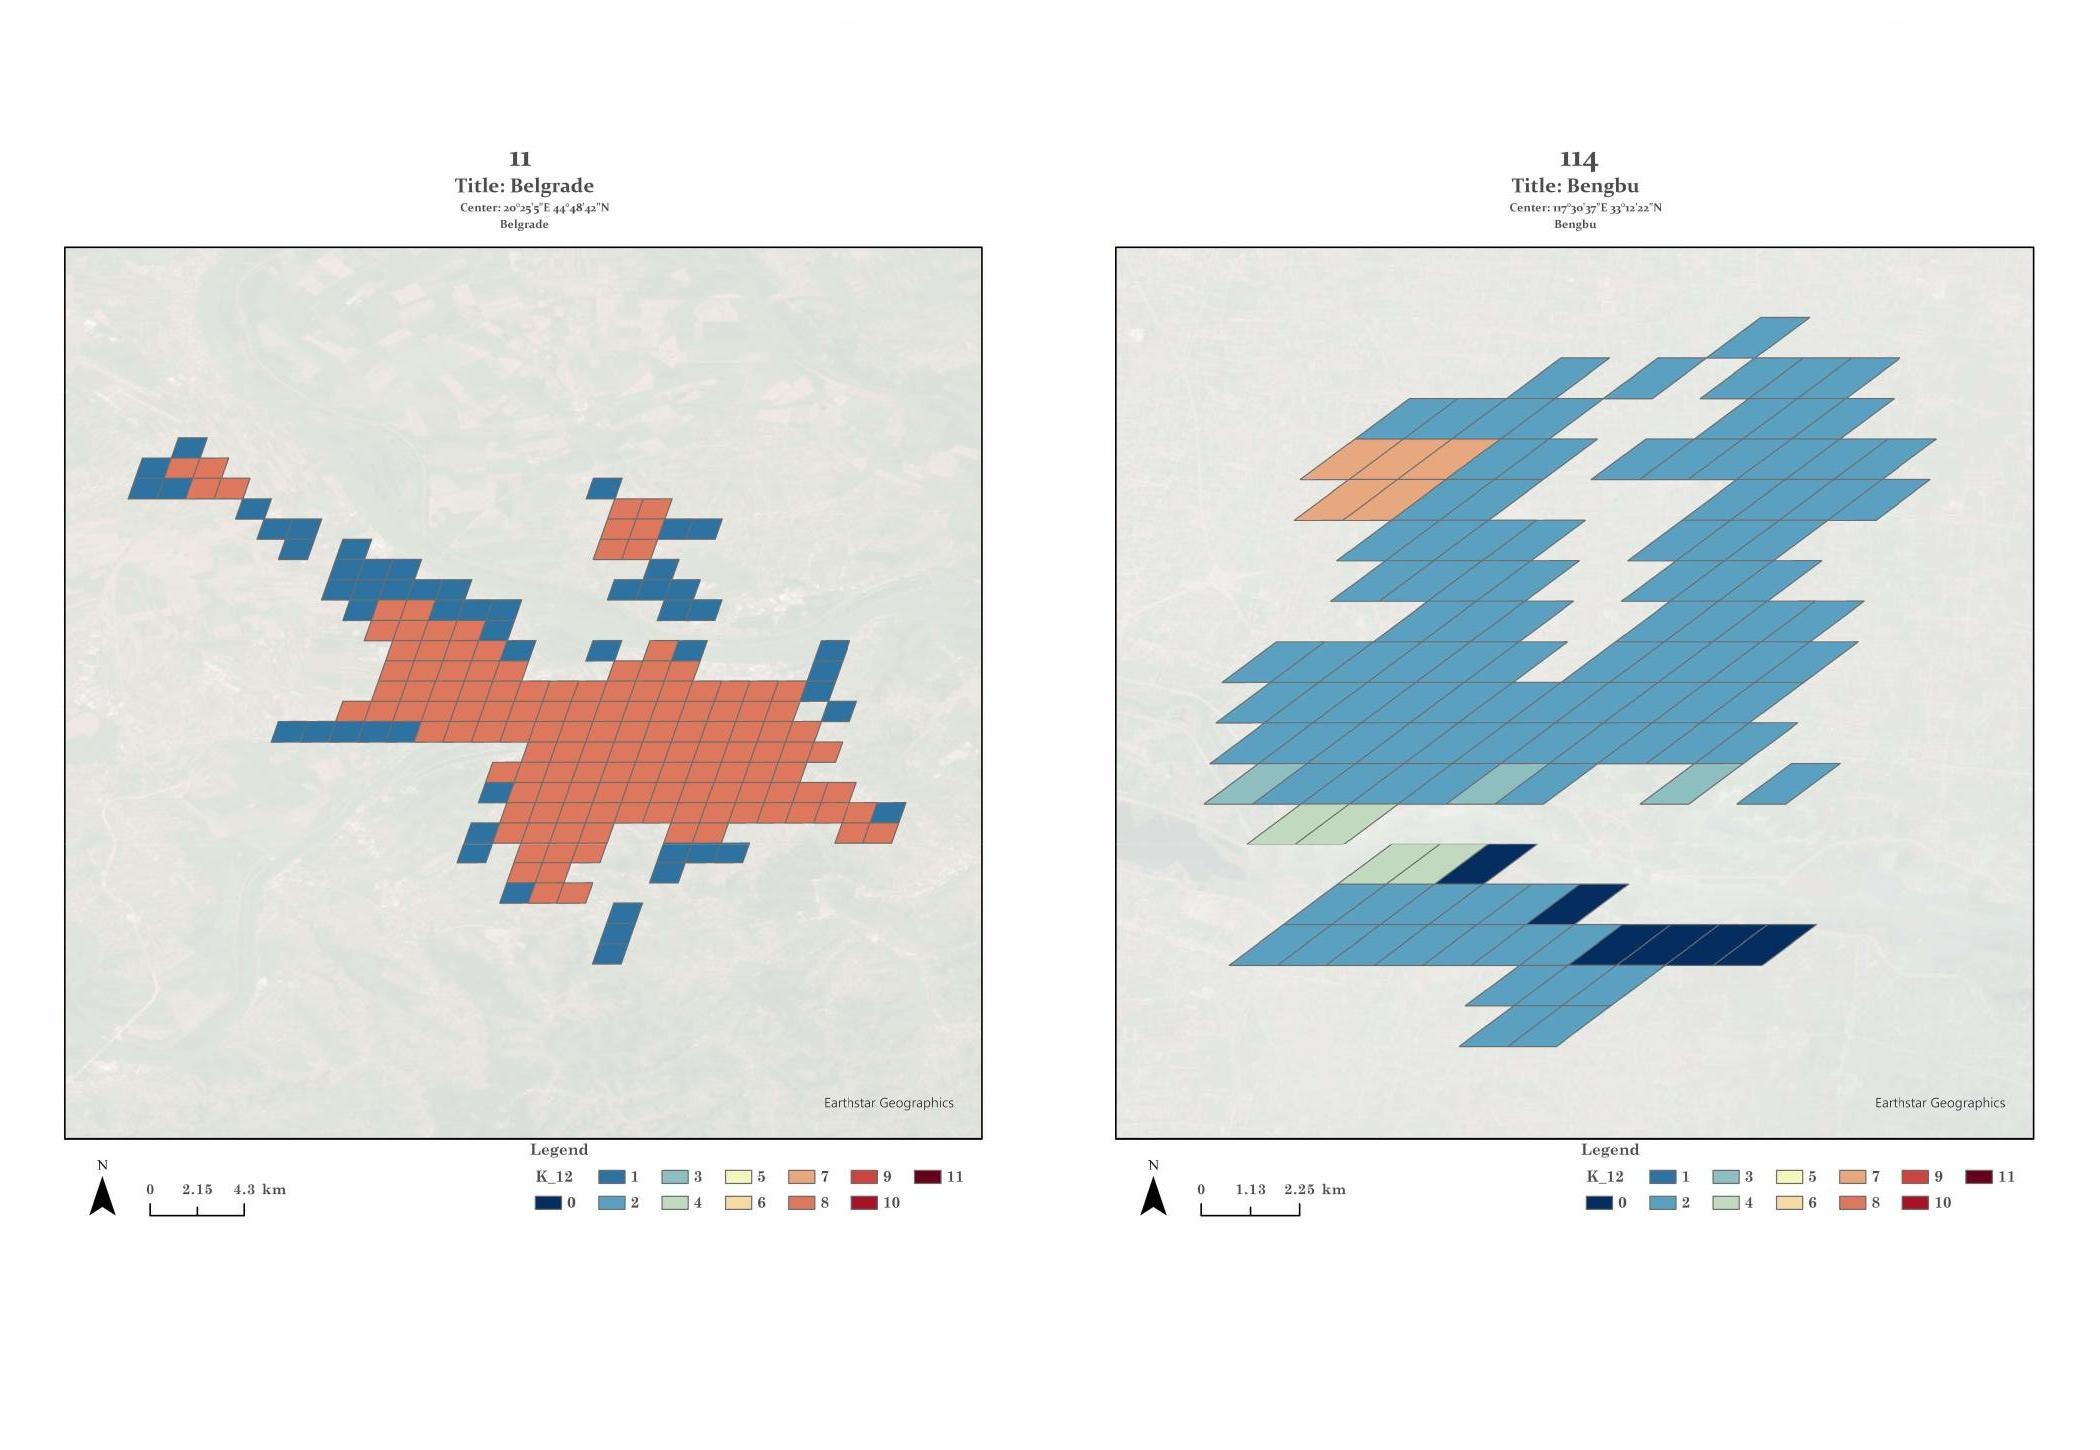
compressed 223 cities in global data and revelas pattern from window period of time-series data from 2017 to 2019 with both day and night time data Implemented PCA to reduce dimensions while preserving variance, and K-Means to identify clusters. Leveraged Three.js for rendering and React for UI management, ensuring smooth interactivity and performance.